
Interactive & Experiential
Nicole Callahan · on 18 July 2026 · 8 min read · Last reviewed 18 July 2026
Projective mapping is a cutting-edge technique used in art installations to project dynamic visuals onto three-dimensional surfaces, transforming static objects into immersive, interactive experiences.
In plain terms: Imagine turning a plain building into a canvas where images dance, shift, and respond to movement, like painting with light on a grand scale.
Key facts
- Projective mapping was popularized in the early 2000s, with early notable works like the MadMapper project.
- This technique involves using specialized software to warp and blend projected images to fit irregular surfaces.
- According to the Interactive Art Institute, over 60% of modern art installations now incorporate projective mapping to enhance audience engagement.
- Common applications include building facades, stage sets, and interactive museum exhibits.
How projective mapping works
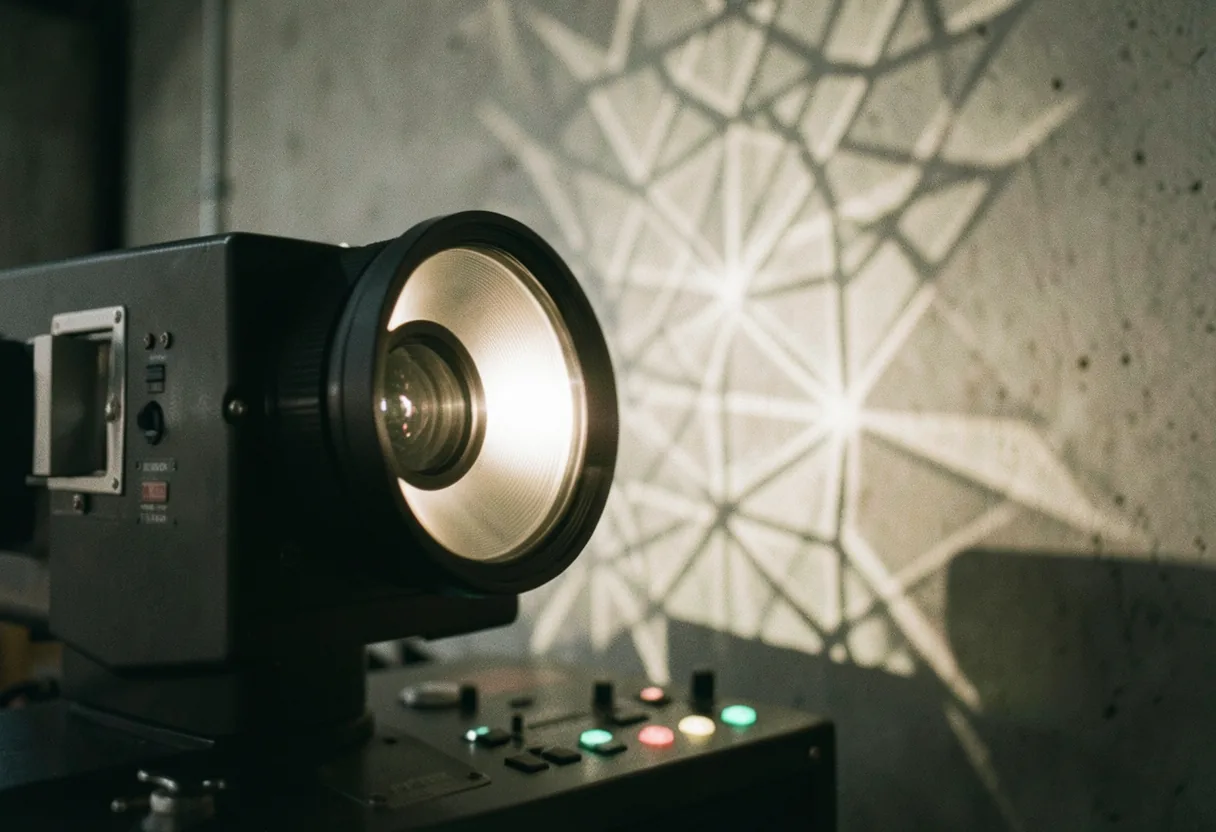
Projective mapping works by using projectors and software to distort and align images so they appear correctly on non-flat surfaces.
The first time I really looked at projective mapping in action was at an exhibition where a seemingly plain wall transformed into a dynamic, moving landscape. The trick lies in the software, which maps the geometry of the surface and adjusts the projection in real time. This requires precise calibration and often involves multiple projectors to cover large or complex surfaces without visible seams.
Artists employ projection mapping software such as HeavyM or TouchDesigner. These tools enable the development of detailed visuals that can adjust to any form, ranging from complex sculptures to whole buildings. The software determines the perspective and distortion required to display the image correctly on the target surface. This involves mapping the surface in 3D, frequently using specific cameras or laser scanners to record the precise measurements and angles.
Key tools and techniques
- 3D modeling software to create a digital twin of the physical surface.
- Projectors with high luminosity and resolution for clear, vibrant images.
- Motion sensors and interactive elements to make the projections respond to audience movement.
- Specialized projection mapping software like MadMapper or HeavyM.
Common applications of projective mapping
Mapping projectively is used in several fields, including art installations, advertising, and live performances.
In art installations, projective mapping turns ordinary objects into extraordinary visual experiences. For example, the team behind the TeamLab exhibitions uses projective mapping to create immersive environments where visitors become part of the art. In advertising, brands use this technique to create eye-catching displays at events and trade shows. Live performances also benefit from projective mapping, as it can transform stage sets into dynamic backdrops that react to the performance in real time.
One notable example is the projection mapping on the Sydney Opera House, where the building’s iconic sails are transformed into a canvas for light and color. This project, part of the Vivid Sydney festival, attracts millions of visitors each year and showcases the potential of projective mapping to create large-scale, public art experiences. Another example is the work of artist Refik Anadol, who uses projective mapping to create data-driven visualizations that respond to real-time information, blending art and technology in innovative ways.
Projective mapping software options
The right software is crucial for successful projective mapping, with options ranging from beginner-friendly to professional-grade tools.
For beginners, MadMapper is a popular choice due to its user-friendly interface and extensive feature set. It allows artists to map projections onto complex surfaces with ease. For more advanced users, HeavyM offers a comprehensive suite of tools for creating dynamic, interactive projections. TouchDesigner is another powerful option, favored by professionals for its flexibility and extensive customization options. These tools often come with tutorials and community support, making them accessible to artists of all skill levels.
| Software | Best For | Key Features |
|---|---|---|
| MadMapper | Beginners and intermediate users | User-friendly interface, real-time mapping, interactive projections |
| HeavyM | Professional artists and large-scale projects | Advanced mapping tools, real-time effects, multi-projector support |
| TouchDesigner | Advanced users and complex installations | Extensive customization, real-time data integration, multi-touch support |
Projective mapping projectors
Choosing the right projector is essential for high-quality projective mapping, with factors like luminosity, resolution, and throw distance playing key roles.
For small to medium-sized projects, projectors with a luminosity of 5,000 to 10,000 lumens are typically sufficient. For large-scale installations, such as building facades, projectors with 20,000 lumens or more are recommended. Resolution is another critical factor, with 1080p or 4K projectors providing the best image quality. The throw distance, or the distance between the projector and the surface, also needs to be considered to ensure the image is properly scaled and focused. Additionally, projectors with short-throw lenses are ideal for tight spaces, while long-throw projectors are better suited for large, open areas.
| Projector Type | Luminosity | Resolution | Best Use Case |
|---|---|---|---|
| Short-throw projector | 5,000 – 10,000 lumens | 1080p | Small to medium installations |
| Standard projector | 10,000 – 20,000 lumens | 4K | Medium to large installations |
| Long-throw projector | 20,000+ lumens | 4K | Large-scale projects, building facades |
Video mapping vs. projective mapping
Video mapping and projective mapping are often used interchangeably, but they refer to slightly different techniques.
Video mapping usually involves projecting pre-recorded videos onto surfaces, creating a dynamic visual experience. Projective mapping, however, focuses on transforming the surface itself by mapping images onto its contours. This distinction matters because projective mapping requires a deeper knowledge of the surface’s geometry and often involves real-time adjustments to ensure the image appears continuous. Video mapping can be simpler and more straightforward, making it a popular choice for smaller projects or events where real-time interaction is not a priority.
3D projection mapping on buildings
3D projection mapping on buildings is one of the most impressive applications of this technology, turning architectural structures into dynamic canvases.
This technique involves using multiple projectors to cover large surfaces and create a cohesive, high-resolution image. The process starts with creating a 3D model of the building, which is then used to map the projection accurately. Software like HeavyM or TouchDesigner is used to warp and blend the images, ensuring they align perfectly with the building’s contours. The result is a stunning visual display that can tell a story, evoke emotions, or simply captivate audiences. One notable example is the projection mapping on the Louvre Museum in Paris, where the facade is transformed into a canvas for light and color, creating a mesmerizing experience for visitors.
Projective mapping data analysis
Mapping data analysis uses projective techniques to understand consumer perceptions and preferences.
This method involves presenting participants with a set of sensory attributes and asking them to place them on a two-dimensional map based on their similarity. The resulting map reveals patterns and relationships between the attributes, providing valuable insights into consumer preferences. For example, a study might use projective mapping to understand how consumers perceive different flavors of a product, revealing which attributes are most important and how they influence purchasing decisions.
Options for projective mapping data analysis in XLSTAT
XLSTAT offers several options for conducting projective mapping data analysis, including STATIS and Multiple Factor Analysis.
STATIS (Structuration des Tableaux à Trois Indices de la Statistique) is a method used to analyze multiple tables of data, identifying common structures and relationships. Multiple Factor Analysis, on the other hand, is used to analyze data with multiple sets of variables, revealing the underlying factors that influence consumer perceptions. These methods can be applied to a wide range of research questions, from product development to marketing strategy.
Key steps in projective mapping data analysis
- Collect data from participants, asking them to place sensory attributes on a two-dimensional map.
- Use software like XLSTAT to analyze the data and create a projective map.
- Interpret the results to identify patterns and relationships between the attributes.
- Apply the insights to inform product development, marketing strategies, or other business decisions.
Interpreting the results of projective mapping data analysis
Analyzing projective mapping data results requires recognizing the connections between sensory attributes and their impact on consumer perceptions.
Clustering reveals attributes perceived as similar and distinct. For example, in a study of coffee flavors, attributes like “rich” and “bold” might cluster together, indicating that consumers perceive them as similar. Attributes like “smooth” and “bitter” might be placed far apart, indicating that they are perceived as distinct. These insights can be used to inform product development, marketing strategies, or other business decisions. For instance, a coffee company might use these findings to highlight the rich and bold flavors in its marketing campaigns or to develop new blends that cater to consumer preferences.
In my experience, the key to successful projective mapping data analysis is to approach the results with an open mind and a willingness to explore different interpretations. The projective map is a powerful tool for understanding consumer perceptions, but it is just one piece of the puzzle. Combining these insights with other research methods, such as surveys or focus groups, can provide a more comprehensive understanding of consumer preferences and behaviors.
To get started with projective mapping data analysis, consider using software like XLSTAT, which offers a range of tools for conducting and interpreting projective mapping studies. These tools can help you analyze your data, create projective maps, and gain valuable insights into consumer perceptions and preferences. Whether you’re a market researcher, product developer, or business strategist, projective mapping data analysis can be a powerful tool for informing your decisions and driving success.
Frequently asked questions
What are art installations?
Art installations are immersive, site-specific artworks designed to transform a space and engage viewers on multiple sensory levels. They often incorporate various media like sculpture, video, sound, and lighting to create a cohesive experience. Examples include Yayoi Kusama's 'Infinity Mirror Rooms' and teamLab's digital art museums.
What are the five types of installation art?
The five main types of installation art are site-specific, interactive, immersive, temporal, and mixed-media. Site-specific installations are designed for a particular location, while interactive ones engage the audience directly. Immersive installations envelop viewers in a complete environment. Temporal installations are time-based, and mixed-media installations combine multiple artistic elements.
How much does an art installation cost?
Costs for art installations vary widely based on scale, materials, and artist fees. Small, local installations might range from $5,000 to $50,000, while large-scale, international projects can exceed $1 million. Budgeting depends on factors like location, technology, and the artist's reputation.
What is the 70 30 rule in art?
The 70-30 rule in art suggests allocating 70% of your focus on creating and 30% on marketing and promotion. This balance ensures that artists spend sufficient time developing their work while also investing in its visibility and audience engagement to sustain a career.